Overview
The paper presents a machine learning approach for classification of hypertrophic cardiomyopathy phenotypes using native T1 mapping radiomics.
Citation of the Paper
Antonopoulos, A.S., Boutsikou, M., Simantiris, S. et al. Machine learning of native T1 mapping radiomics for classification of hypertrophic cardiomyopathy phenotypes. Sci Rep 11, 23596 (2021). https://doi.org/10.1038/s41598-021-02971-z
FAQs
Explain Abstract of this paper in simple terms
The paper explores the use of machine learning techniques to classify hypertrophic cardiomyopathy (HCM) phenotypes using radiomic features of the left ventricle. Radiomic features are mathematical representations of the texture and intensity of medical images. The study found that these features are useful in identifying different HCM phenotypes, which may have important implications for diagnosis and treatment of the disease.
Explain Abstract of this paper in 2 lines
The paper investigates machine learning techniques to identify hypertrophic cardiomyopathy (HCM) phenotypes using radiomic features. The study shows that radiomic features can be used to classify different HCM phenotypes, which could aid in diagnosis and treatment of the disease.
Explain Abstract of this paper like I am five years old
The paper talks about using computers to help doctors identify different types of heart problems. They do this by looking at pictures of the heart and finding patterns in the picture that tell them which type of heart problem it is. This can help doctors give the right treatment to the patient.
What are the contributions of this paper
The paper shows that radiomic features can be used to classify different types of hypertrophic cardiomyopathy (HCM) phenotypes, which can aid in the diagnosis and treatment of the disease. This demonstrates the potential of machine learning techniques in medical image analysis and highlights the importance of considering radiomic features for clinical decision making.
Explain the practical implications of this paper
The paper suggests that machine learning techniques can be used to improve diagnosis and treatment of hypertrophic cardiomyopathy (HCM) by identifying different HCM phenotypes. This can help doctors give more targeted treatment to patients, potentially improving outcomes and quality of life. The use of radiomic features in medical imaging analysis may also have broader applications in other areas of medicine.
Summarize introduction of this paper
The introduction of this paper provides an overview of hypertrophic cardiomyopathy (HCM), a heart disease that affects the structure of the heart muscle. The authors discuss the limitations of current diagnostic methods, which rely on subjective assessments of echocardiograms and other imaging techniques. They argue that there is a need for more objective and quantitative measures to aid in the diagnosis and classification of HCM.
The authors propose the use of radiomic features, which are mathematical representations of the texture and intensity of medical images, as a potential solution. They describe how these features can capture subtle differences in tissue composition and microstructure that may be indicative of different HCM phenotypes. The authors also highlight the potential of machine learning techniques to analyze large amounts of radiomic data and identify patterns that may not be apparent to the naked eye.
The authors then outline the objectives of the study, which include identifying radiomic features that are stable across different imaging modalities, exploring the relationships between different radiomic features, and using machine learning techniques to classify different HCM phenotypes based on radiomic features. They also describe the study design, which involved two separate cohorts of patients, and the methods used to extract and analyze radiomic data from cardiac MRI scans.
Overall, the introduction provides a detailed background and rationale for the study, highlighting the potential of radiomic features and machine learning techniques to improve the diagnosis and classification of HCM.
Methods used in this paper
Study Population
The study comprised two arms, with the first arm comprised of 20 CMR scans with available native T1 mapping randomly selected by their archive, which served for the purpose of stability assessment (i.e., inter-observer variability) of extracted radiomic features from T1 maps, which were included in further analysis in Study Arm 2.
Study Arm 2 included a total of 152 consecutive patients undergoing a CMR scan (period 2019–2020) and native T1 mapping as follows: individuals without evidence of structural heart disease on CMR (n = 30), patients with left ventricular hypertrophy (LVH, i.e. increased wall thickness ≥ 12 mm or increased LV mass index) of various causes (athletes, valvular heart disease, hypertension etc., n = 30), patients with known HCM (n = 61) and patients with known cardiac amyloidosis (n = 28).
The complete data pipeline, data sampling and ML workflow can be found in the Fig 1. 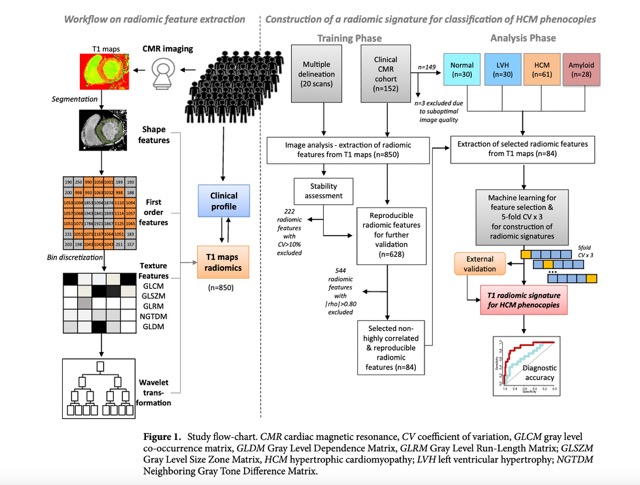
Data Extraction and Analysis
They extracted a total of 850 radiomic features from T1 maps by cardiac magnetic resonance (CMR) and explored their value in disease classification. They applied principal component analysis and unsupervised clustering in exploratory analysis, and then machine learning for feature selection of the best radiomic features that maximized the diagnostic value for cardiac disease classification.
They used the following steps to process the data:
- Radiomic feature extraction: Radiomic features were extracted from the T1 maps using the PyRadiomics library.
- Exploratory analysis: Unsupervised hierarchical clustering was performed on the extracted radiomic features.
- Feature selection: The authors used machine learning algorithms to select the best radiomic features for classification of cardiac disease phenotypes. They used a combination of random forests and recursive feature elimination (RFE).
- Model validation: The selected radiomic features were used to train a machine learning model for classification of cardiac disease phenotypes. The model was validated using internal and external datasets.
- The diagnostic performance of the radiomics model was evaluated using the area under the receiver operating characteristic curve (AUC).
- Statistical analysis was performed using chi-squared tests and logistic regression models.
The exploratory data analysis can be found in the Fig 2. 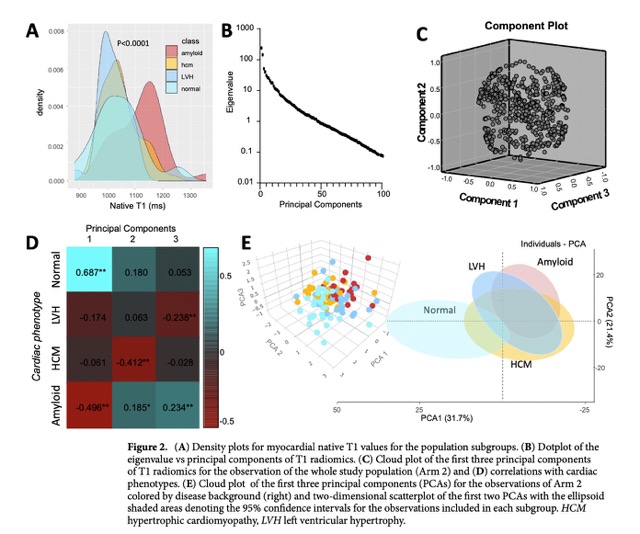
Results of the paper
The results of the paper are as follows:
- The first three principal components of the T1 radiomics were distinctively correlated with cardiac disease type.
- Unsupervised hierarchical clustering of the population by myocardial T1 radiomics was significantly associated with myocardial disease type.
- After feature selection, internal validation, and external testing, a model of T1 radiomics had good diagnostic performance (AUC 0.753) for multinomial classification of disease phenotype (normal vs. LVH vs. HCM vs. cardiac amyloid).
- A subset of six radiomic features outperformed mean native T1 values for classification between myocardial health vs. disease and HCM phenocopies.
Therefore, the results of the paper suggest that myocardial texture assessed by native T1 maps is linked to features of cardiac disease, and myocardial radiomic phenotyping could enhance the diagnostic yield of T1 mapping for myocardial disease detection and classification.
The performance analysis anc confusion matrix can be found in the Fig 4. 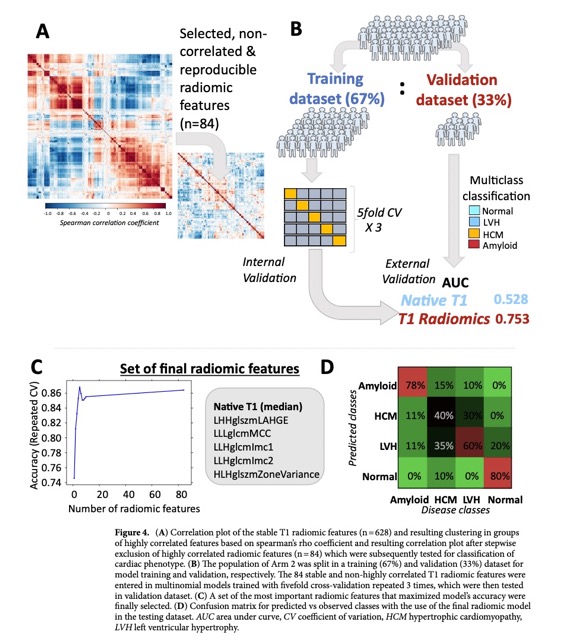
Conclusions from the paper
The conclusions from the paper are as follows:
- Radiomic features provide added diagnostic value for distinction between healthy and diseased myocardium, as well as for differentiation between HCM and relevant phenocopies, such as amyloidosis, on top of native T1.
- The application of radiomics to standard native T1 mapping is a promising approach for the texture characterization of the human myocardium and for further enhancing the diagnostic value of CMR.
Therefore, the paper suggests that myocardial radiomic phenotyping using T1 radiomics analysis could enhance the diagnostic yield of T1 mapping for myocardial disease detection and classification.
Limitations of this paper
The limitations of this paper are as follows:
- The study was conducted at a single center with a relatively small sample size, which may limit the generalizability of the findings.
- Only the basal slice of the T1 maps was used for texture analysis, which may not fully represent the entire myocardium.
- The reproducibility of radiomics features across different scanners/vendors and acquisition sequences is still an issue, which may limit the clinical application of radiomics.
- The study did not include a comparison with other imaging modalities or biomarkers, which may limit the assessment of the added diagnostic value of radiomics.
- The study did not include a longitudinal follow-up to assess the prognostic value of radiomics features for disease progression or response to treatment.
Therefore, these limitations should be taken into consideration when interpreting the results of the study.
Future works suggested in this paper
The future works suggested in this paper are as follows:
- Further research is needed to harmonize the readouts between different scanners/vendors and acquisition sequences to address the reproducibility issues of radiomics.
- Future studies should include a larger sample size and a multi-center design to validate the findings of this study and improve the generalizability of the results.
- Future studies should also include a comparison with other imaging modalities or biomarkers to assess the added diagnostic value of radiomics.
- Longitudinal follow-up studies are needed to assess the prognostic value of radiomics features for disease progression or response to treatment.
- Future studies should also investigate the potential of radiomics for other CMR applications, such as perfusion imaging and late gadolinium enhancement imaging.
Therefore, these future works could help to further validate and improve the clinical application of radiomics in CMR.
Advanced Questions
How does the use of radiomics analysis enhance the diagnostic value of CMR for myocardial texture phenotyping?
Using radiomic features can improve the ability of CMR to distinguish between healthy and diseased myocardium, as well as between HCM and other similar conditions. Radiomic features provide additional information about the texture and heterogeneity of the myocardium that may not be captured by conventional CMR parameters like native T1 values. Radiomic features are quantitative measures of image texture and heterogeneity that can be extracted from medical images using advanced image processing techniques.
In this study, the authors extracted radiomic features from T1 maps generated by CMR and used machine learning to identify the best radiomic features for classifying cardiac disease. The results showed that a model using T1 radiomics had good diagnostic performance for categorizing different types of cardiac disease. Additionally, a subset of six radiomic features performed better than mean native T1 values for differentiating between healthy and diseased myocardium and identifying HCM phenocopies.
Therefore, using radiomic features can enhance the accuracy of T1 mapping for detecting and classifying myocardial disease.
The population heatmap can be found in the Fig 3. 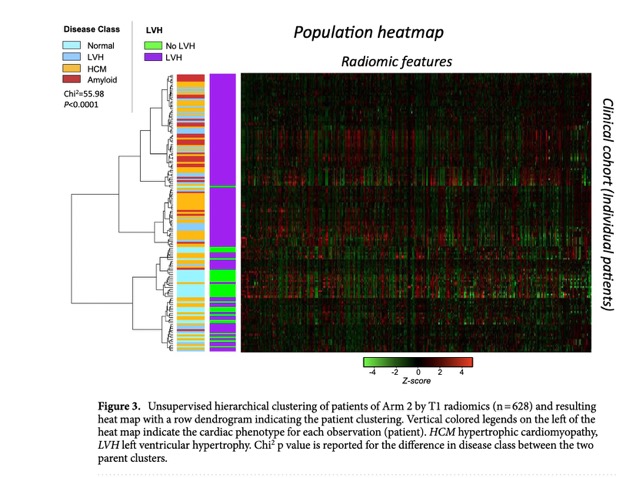
What were some limitations of this study, and how might they impact the generalizability of its findings to other populations or imaging settings?
The limitations of the study are summarized above in the limitations section.
These limitations may impact the generalizability of the findings to other populations or imaging settings. Therefore, further studies with larger sample sizes, multi-center designs, and longitudinal follow-up are needed to validate the findings of this study and improve the generalizability of the results. Additionally, the reproducibility of radiomics features across different scanners/vendors and acquisition sequences should be addressed to improve the clinical application of radiomics.
Can you explain how radiomic features are extracted from medical images, and what types of information they can provide about tissue volume, shape, and texture?
Radiomic features are quantitative measures of image texture and heterogeneity that can be extracted from medical images using advanced image processing techniques. In this study, radiomic features were extracted from T1 maps by CMR. The process of extracting radiomic features involves the following steps:
- Image acquisition: Medical images are acquired using various imaging modalities such as CT, MRI, or PET.
- Image segmentation: The anatomical volumes of interest are segmented from the background using manual or automated methods.
-
Feature extraction: Radiomic features are extracted from the segmented volumes using mathematical algorithms that analyze the spatial relationship of (dis)similar voxels. These features can provide information on tissue volume, shape, and texture, such as:
- First-order statistics: Measures of the distribution of pixel/voxel intensities, such as mean, median, standard deviation, skewness, and kurtosis.
- Second-order statistics: Measures of the spatial relationship between pixels/voxels, such as gray-level co-occurrence matrix (GLCM), gray-level run-length matrix (GLRLM), and gray-level size zone matrix (GLSZM).
- Higher-order statistics: Measures of the spatial relationship between higher-order features, such as fractal dimension, wavelet transform, and Laplacian of Gaussian (LoG).
Radiomic features can provide additional information about tissue texture and heterogeneity that may not be captured by conventional imaging parameters. Therefore, radiomic analysis has the potential to enhance the diagnostic and prognostic value of medical imaging for various diseases.
The most important radiomic features selected can be found in the Table 2. 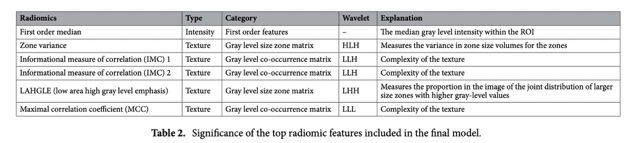
In what ways has radiomic phenotyping been successfully used in other medical fields such as clinical oncology? Are there any key differences between these applications and those explored in this paper?
Radiomic phenotyping has been successfully used in clinical oncology to characterize the distinct biological phenotypes of tumors and provide relevant information for diagnosis, prognosis, and treatment planning. For example, radiomic features extracted from CT or MRI images of lung cancer have been shown to be associated with tumor stage, histology, and patient survival. Similarly, radiomic features extracted from MRI images of glioblastoma have been shown to be associated with tumor grade, molecular subtype, and patient survival.
The key difference between these applications and those explored in this paper is the imaging modality and the disease being studied. In this paper, radiomic features were extracted from T1 maps by CMR to enhance the diagnostic value of T1 mapping for myocardial disease detection and classification. Therefore, the application of radiomic phenotyping in this paper is specific to CMR and myocardial disease. However, the underlying principle of radiomic analysis is the same across different imaging modalities and diseases, which is to extract quantitative measures of image texture and heterogeneity that can provide additional information for disease characterization and management.
The most important radiomic phenotyping predictors data can be found in the Table 1. 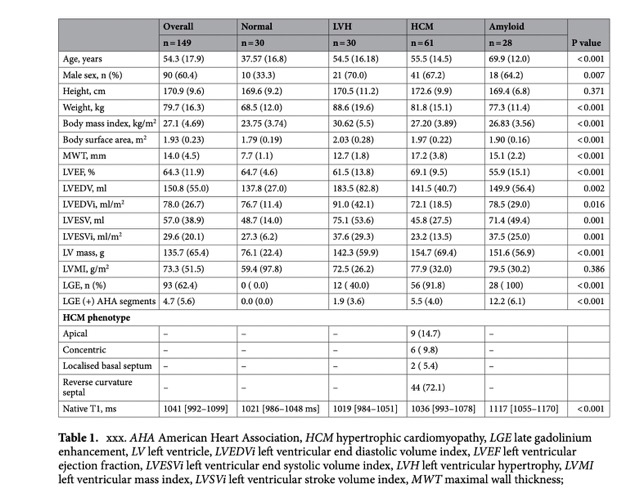
What were the principal components identified through the principal component analysis and how were they used to explore associations with disease background?
The principal component analysis (PCA) was performed on the radiomic features extracted from T1 maps by CMR to identify the principal components (PC) that describe most of the phenotypic variation in the study population. The first two components (PC1, PC2) were used to explore associations with disease background in relevant cluster plots. The first three principal components of the T1 radiomics were distinctively correlated with cardiac disease type. The unsupervised hierarchical clustering of the population by myocardial T1 radiomics was significantly associated with myocardial disease type (chi 2 = 55.98, p < 0.0001). Therefore, the PCA helped to identify the most relevant radiomic features that are associated with cardiac disease type and provided a basis for further analysis of the radiomic features.
The pinciple component analysis can be found in the Fig 2.
Can you explain the process of stability assessment of extracted radiomic features from T1 maps and how it was used to limit the analysis to radiomic features that could be of value as imaging biomarkers?
The stability assessment of extracted radiomic features from T1 maps was performed to limit the analysis to radiomic features that could be of value as imaging biomarkers. The process involved the following steps:
- Twenty scans from Study Arm 1 were used to assess the coefficient of variation (CV) of each radiomic feature in multiple delineations by two independent operators.
- The CV was calculated as the ratio of the standard deviation to the mean of the radiomic feature across multiple delineations.
- Only those radiomic features with multiple delineation CV < 10% were included in further analysis (n = 628).
- This step was performed to ensure that the radiomic features were stable and reproducible across different delineations and operators.
- The remaining radiomic features were then used for further analysis, including exploratory analysis, feature selection, and machine learning for disease classification.
By performing the stability assessment, the study was able to limit the analysis to radiomic features that were stable and reproducible, which could be of value as imaging biomarkers for disease classification. This step helped to ensure that the radiomic features used in the analysis were reliable and could provide meaningful information for disease characterization.
What specific machine learning algorithms were used in this study for feature selection and classification of cardiac disease phenotype?
The paper did not provide specific details on the machine learning algorithms used for feature selection and classification of cardiac disease phenotype. However, the paper mentioned that machine learning was used for feature selection of the best radiomic features that maximized the diagnostic value for cardiac disease classification. The paper also mentioned that a model of T1 radiomics had good diagnostic performance (AUC 0.753) for multinomial classification of disease phenotype (normal vs. LVH vs. HCM vs. cardiac amyloid). Therefore, the study used machine learning algorithms for feature selection and classification of cardiac disease phenotype, but the specific algorithms used were not mentioned in the paper.